
At some point, you will run into an error or fault in your application that causes it to produce an unexpected result. This type of error is usually referred to as bugs. The act of removing such bugs when found (either by developers, QA, or users) is known as debugging.
In this article, we will talk about everything you need to know about debugging Node.js applications. Let’s get started.
Node.js is a runtime environment that runs on the Chrome V8 engine and takes JavaScript out of the browser. Node.js is cross-platform and runs on different OSs like Windows, MAC, and Linux.
Simply put: Node.js lets you execute JavaScript code without a browser, and without the limitations of a browser, you can make a web server, create a game, open and read files from the server, etc.
Using Node.js comes with a lot of advantages, some of which are:
Knowing how to properly debug code that is being used saves hours of development time. Debugging doesn’t only save development time, it also helps software developers trace errors back to their source and fix them. When debugging developers can easily find and fix syntax and logical errors in their applications.
Debugging can also improve the quality of the application.
No matter whether you’re developing simple or complex Node.js applications, there are bound to be bugs. No software application is actually bug-free. Finding and fixing those bugs (errors) in your Node.js applications is referred to as Node.js debugging.
The steps taken to debug a software application depend solely on the developer. However, there is a set procedure to conduct effective debugging. The steps are:
When it comes to debugging Node.js applications, a lot of developers use console.log and just print statements to the console. While this seems to work fine, it is not usually the best approach to take when debugging a complex Node.js application.
To properly debug your applications, you’ll need a debugger-an application designed to step through code execution line by line, examine the states of variables and tell developers which code has been executed and why. When using a debugger, you can examine variables if they have a wrong variable or where in the program the value changed.
When it comes to debuggers, there are quite a few you can use to debug your Node.js applications. The common ones are Chrome DevTools, VSCode, Eclipse, and IntelliJ.
The inspect flag is used to start the Node.js debugging section, which in turn allows us to attach any debugging client like Chrome DevTools. For example:
node inspect <name of file: eg. index.js>
To attach Chrome DevTools to your Node.js after using the inspect flag, open chrome://inspect in a Chromium-based browser.
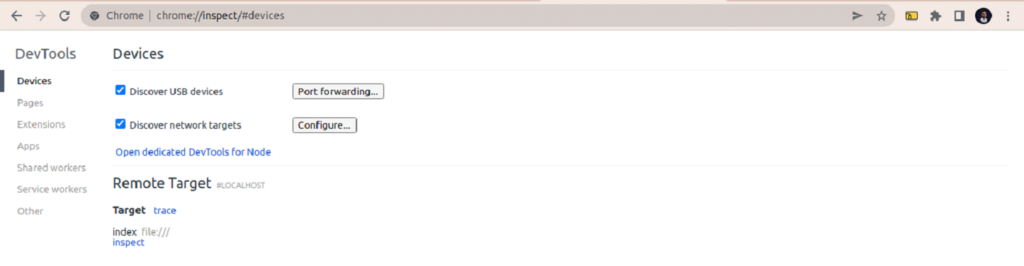
Click the inspect link to start debugging.
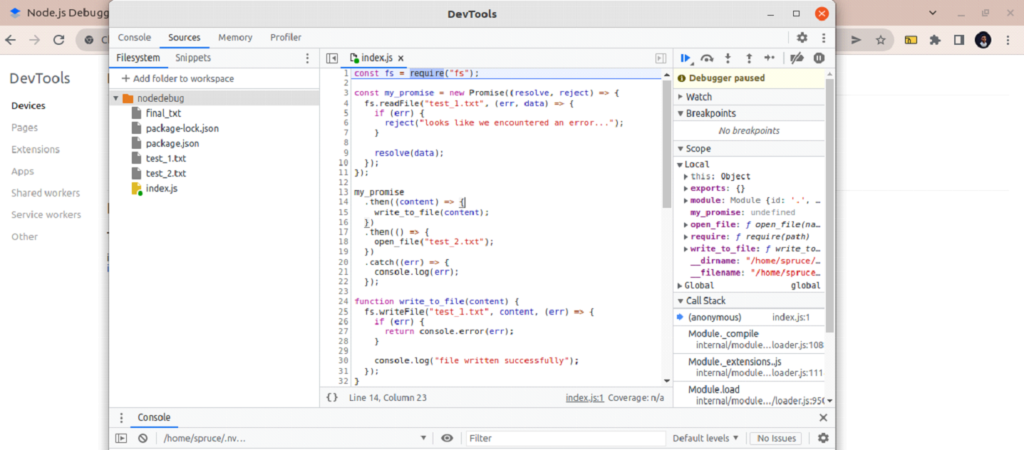
To open your project, click + Add Folder to workspace and grant the necessary permissions. Your project will appear on the left side.
To add a breakpoint (a point where code execution should stop), click on the code line number. The line is then marked blue.
To watch a particular variable and see its value when execution is paused, click on the + Icon in the Watch panel and add the variable name.
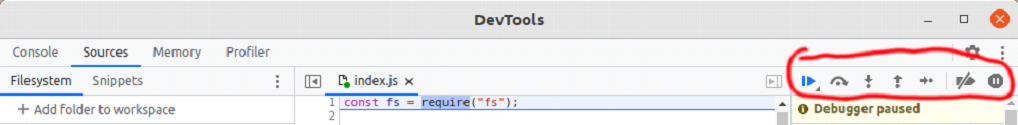
Use the buttons on the left to pause or resume execution, step over, step in, or step through your code, and deactivate breakpoints.
Debugging a Node.js application on VSCode can easily be done without any configuration at all. Just hit the F5 button or the Run and Debug button.
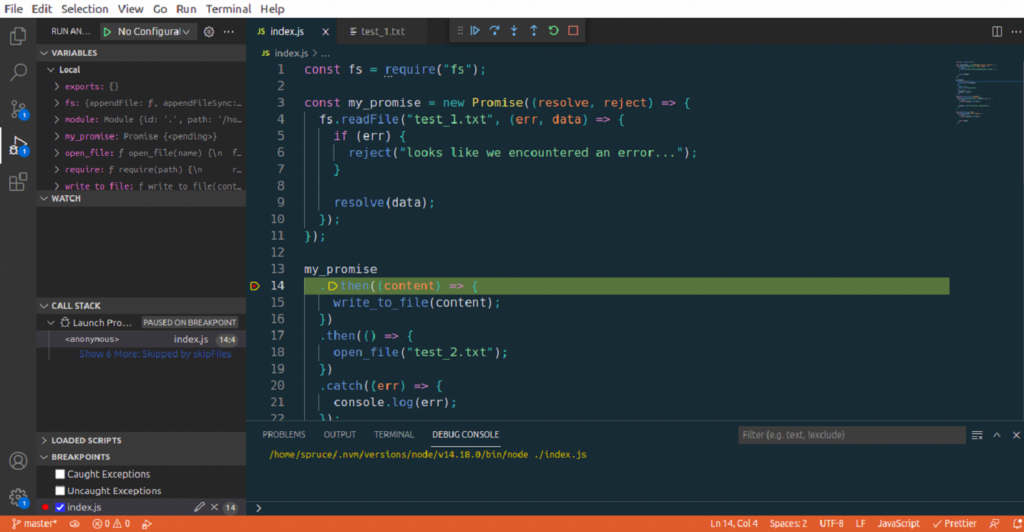
Debugging with VSCode is quite similar to using Chrome DevTools. To add breakpoints click on the line number. In the debug toolbar, you will find icons similar to those found in Chrome DevTools. They perform similar actions too.

To debug your Node.js applications with Eclipse you can right click on any JavaScript file and select “Debug As… > Node program” or you can create a debug configuration, follow these steps to create a debug configuration:
After Creating your Debug Configuration, Right Click on your JavaScript file and Select Debug As —> Debug Configurations.

To debug your Node.js applications with IntelliJ you can attach the debug to your application already running in debug mode:
node --inspect <name of file: eg. index.js>Just like mistakes are inevitable in our daily lives, when developing software applications, mistakes are usually (almost always) caused by the developer. Nearly all bugs encountered in software applications are caused by mistakes made by the developer or co-developer. Mistakes equal bugs. In Node.js, there are some common mistakes made by Node.js developers that you should avoid making. Here are some of the most common mistakes and how to avoid them:
Blocking Node.js event loop happens when you have written code that must finish running before another code execution begin. To quote the Node.js docs, this happens because “the event loop is unable to continue running JavaScript while a blocking operation is occurring”.
Normally, codes that block event loops are usually synchronous (they block other instructions until the task is completed). Take a look at the following code:
const fs = require("fs");
fs.readFileSync("my_file.png");
const content = "Hello world"

// This code(and every below) waits for the above code to finish executing before running
fs.writeFileSync('hello.txt', content)

// all other code waiting....
In the above snippet, I read an image file from my file system and then, depending on the time it took to complete, wrote “hello world” in another file. You’ll notice that the two codes are not dependent on each other, but the latter has to wait for the former. And if, for any reason, we fail to read the image file, the whole app crashes.
To avoid this sort of problem, you have to write your code asynchronously. The following solution will fix the problem:
const fs = require("fs");
fs.readFile('/file.md', (err, data) => {
  if (err) throw err;

  console.log("file read....")
});

const content = "Hello world"

// This code dosent't have to wait for the above
fs.writeFileSync('hello.txt', content, err => {
  if (err) {
    console.error(err)
    return
  }
  //file written successfully
})
Now, both our codes run without one waiting for the other. If anyone fails to execute, it doesn’t stop the execution of the other.
A method finishes executing, and a function is called immediately. The function that gets called is referred to as a callback. See example below:
const fs = require("fs");
const content = "hello world";

fs.writeFile("test.txt", content, (err) => {
  if (err) {
    return console.log("looks like we encountered an error...");
  }

  console.log("hey I'm done writing");
});
When the method fs.writeFile() finishes writing to the file test.txt the callback function prints “hey I’m done writing” to the console.
The above is the first type of callback. There’s another type called anonymous callback. As the name implies, the method and the callback are completely unaware of each other. see example below:
const fs = require("fs");
const content = "hello world";

const my_callback = (err) => {
  if (err) {
    return console.log("looks like we encountered an error...");
  }
  console.log("file written successfully");
  // do some other stuff
};

fs.writeFile("test.txt", content, my_callback);
By writing anonymous callbacks like this, we can easily reuse our callbacks based on different conditions. The problem comes when you mistakenly call them twice – this is very bad for your Node.js application’s performance. Take a look at the following code:
const fs = require("fs");

const my_callback = (message) => {
  console.log(message);
};

fs.readFile("tes.txt", (err, data) => {
  if (err) {
    my_callback("looks like we encountered an error...");
  }
  my_callback(data);
});
What do you think is wrong with the above code? Well, since we are in the spirit of debugging, copy this code to your preferred code editor Node.js environment, create a test.txt, run the code, and see the output.
The above code fails to read the file tes.text because there’s no such file. Rather, we have a test.txt in our file system. But, you’ll notice that the callback happens twice. Even if there is an error, they both get called.
At this point, you might be wondering why my_callback() is getting called twice. Well, that’s because after the if statement—if (err)—there is nothing stopping the code from running Node.js. And We can continue running the code until the last line.
A quick fix for this kind of Node.js problem is to add a return statement. The following lines solve the problem:
const fs = require(“fs”);
const my_callback = (message) => {
  console.log(message);
};
fs.readFile("tes.txt", (err, data) => {
  if (err) {
    return my_callback("looks like we encountered an error...");
  }
  my_callback(data);
});
The JavaScript return statement stops the execution of the code. It is basically saying don’t execute any more code after you have logged “looks like we encountered an error…” to the console.
Another way to fix such a mistake is to always add the Else statement after the If statement, like the one below
const fs = require("fs");

const my_callback = (message) => {
  console.log(message);
};

fs.readFile("tes.txt", (err, data) => {
  if (err) {
    my_callback("looks like we encountered an error...");
  } else {
    my_callback(data);
  }
});
With the addition of the Else statement, there’s no need for the return statement.
Any of the above solutions is perfectly fine for getting rid of such bugs.
One of the problems with callbacks is that maintenance and readability are usually a pain. Take a look at the following problem:
“I have 3 files. I need to pass the content of the first file to the second file, do some calculations, and then pass the answer to the final file.”
Let’s try solving the above problem with callbacks.
const fs = require("fs");

fs.readFile("test_1.txt", (err, data) => {
  if (err) {
    return my_callback("looks like we encountered an error...");
  }
  fs.writeFile("test_2.txt", data, (err) => {
    if (err) {
      return console.error(err);
    }
    fs.readFile("test_2.txt", (err, data) => {
      if (err) {
        return console.error(err);
      }
      fs.writeFile("final_txt", data, (err) => {
        if (err) {
          return console.error(err);
        }
        console.log("file written successfully");
      });
    });
  });
});
Nesting, Nesting, and Nesting. This type of code is very common among JavaScript developers and is usually called callback hell.
This type of code can be very confusing even for developers. A fix for this common Node.js problem is to use promise. Let’s rewrite the above code with promises below:
const fs = require("fs");

const my_promise = new Promise((resolve, reject) => {
  fs.readFile("test_1.txt", (err, data) => {
    if (err) {
      reject("looks like we encountered an error...");
    }
    resolve(data);
  });
});

my_promise
  .then((content) => {
    write_to_file(content);
  })
  .then(() => {
    open_file("test_2.txt");
  })
  .catch((err) => {
    console.log(err);
  });

function write_to_file(content) {
  fs.writeFile("test_1.txt", content, (err) => {
    if (err) {
      return console.error(err);
    }
    console.log("file written successfully");
  });
}

function open_file(name) {
  fs.readFile(name, (err, data) => {
    if (err) {
      return console.error(err);
    }
    return data;
  });
}
Now, the code is more readable and maintainable.
One problem with writing callbacks is that they block the Event loop. We saw an example of this in the Blocking Event Loop section. Asynchronous method will still wait for the callback to finish running before going to or running the next line of code.
Assuming Number to be Integers
Numbers in JavaScript can literally be:
Up until recently, JavaScript had only one number type: floating point. That means JavaScript treats all those numbers above as floating points.
If you work with integers of up to 53 bits magnitude, you are fine. But working large integers creates problems. Copy and run the following code:
const large_number = 999999999999999999999;
console.log(large_number); // 1e+21
The output isn’t quite what you expected? To effectively use large numbers, JavaScript now provides a second number type called BigInt.
A common mistake most Node.js developers make is basing their entire debugging system on console.log. Though this works for many, there are better options like using a debugger.
A major problem with using the console.log for debugging is that you have to do everything manually. It is not suited for large-scale applications.
When using the console.log method for debugging, you have to manually edit your source code, add statements, then save your code, stop and restart the server, and finally reload the browser just to get your messages printed out.
It is true that a lot of developers take different approaches when debugging code. However, there are good practices that every developer must use when debugging.
Linters are tools that analyze source code to flag programming or stylistic errors, bugs, and suspicious constructs. linters can spot those little errors developers make, like calling an undefined variable. It can also provide suggestions for common best practices. A linter would save a developer countless hours of finding and fixing a missing semicolon bug. The most popular linter used by Node.js developers is Eslint.
When using a debugger, developers can easily step through their running code, inspect variables and see where and when variables changed. As mentioned earlier in this article, you can use debuggers like Chrome DevTools or VSCode to assist with Node.js debugging.
Test-Driven Development (TDD) is a software development process that focuses on creating tests before writing the actual code. When using the Test-Driven Development process developers create tests for all features and re-write code when each test fails. Test Driven Development usually follows the following stages:
Stage 1: write tests
Version control systems are software tools that help software developers track and manage changes made to their source code over time. Among developers, Git is the most widely used common version system, Git helps developers track changes made to their code. By using a version control like Git developers can easily revert to specific versions of their code and see what their code looks like before bugs.
By writing clear and concise errors messages, developers and co-developers can easily see and reproduce the bug in order to fix it.
In this article, we talked about everything you need to know about debugging Node.js applications and the various tools you can use to debug your Node.js application. First, we talked about the importance of Node.js debugging and the numerous ways to debug using common debuggers. Then, we looked at some common mistakes developers make in their node.js applications that would require debugging. Finally, we considered some best practices for Node.js debugging.
Ultimately, debugging can be a tedious process if you aren’t familiar with the core purpose of your code and application. Blindly debugging in any programming language is going to be immeasurably difficult, so the first step is making sure that you have your fundamentals down pat. Then, whether you debug with a program or manually, you will know exactly what to look for and how to fix it. Now, debug your Node.js applications like a pro.
